clear
clc
format compact
format shortG
T = readtable('repayment_schedule.xlsx','ReadVariableNames',true)
T.time=datetime(datestr(T.time,'yyyy.mm.dd'),'InputFormat','yyyy.MM.dd',...
    'format','yyyy.MM.dd')
p=plot(T.time,T.m_per_month,T.time,T.m_residue)
p(1).Marker='o'
p(2).Marker='*'
box off
%讓y軸不用科學計數法顯示
h=gca
y_val=h.YTick
y_str=string(y_val) %等價于y_str=num2str(y_val')
h.YTickLabel=y_str
%橫軸日期顯示設置
h.XTick=T.time
xtickangle(45) %讓x軸的標簽逆時針旋轉45度
%畫垂直虛線
hold on
p1=plot([datetime(2018,11,20) datetime(2018,11,20)],...
    [0 30830],'Color',[0.6 0.6 0.6],'LineStyle','--')
p2=plot([datetime(2018,12,20) datetime(2018,12,20)],...
    [0 26434],'Color',[0.6 0.6 0.6],'LineStyle','--')
p3=plot([datetime(2019,01,20) datetime(2019,01,20)],...
    [0 22038],'Color',[0.6 0.6 0.6],'LineStyle','--')
p4=plot([datetime(2019,02,20) datetime(2019,02,20)],...
    [0 17641],'Color',[0.6 0.6 0.6],'LineStyle','--')
p5=plot([datetime(2019,03,20) datetime(2019,03,20)],...
    [0 13245],'Color',[0.6 0.6 0.6],'LineStyle','--')
p6=plot([datetime(2019,04,20) datetime(2019,04,20)],...
    [0 8849],'Color',[0.6 0.6 0.6],'LineStyle','--')
p7=plot([datetime(2019,05,20) datetime(2019,05,20)],...
    [0 4452.8],'Color',[0.6 0.6 0.6],'LineStyle','--')
hold off
%標注每個點
str1=string(T.m_per_month)
str2=string(T.m_residue)
text(T.time,T.m_per_month-1200,str1,'Color',[0 0.447 0.741],...
    'HorizontalAlignment','center')
text(datetime(datenum(T.time)+2,'ConvertFrom','datenum'),...
    T.m_residue+1100,str2,...
    'Color',[0.85 0.325 0.098],...
    'HorizontalAlignment','left')
%圖例
legend([p(1) p(2)],{'每月還款金額','每月還款后剩余總本息'},...
    'Location','northeast','NumColumns',1)
%各個標題
xlabel('還款時間')
ylabel('還款金額')
title({'GGG還款計劃';'2018.12.20-2019.06.20'})
print('GGG還款計劃','-dpdf')
%將數據再寫入excel
% writetable(T,'test.xlsx','WriteVariableNames',true)
%填充并畫網格
clear
clc
v1 = [0 0; 4 0; 4 4;0 4];
f1 = [1 2 3 4];
figure
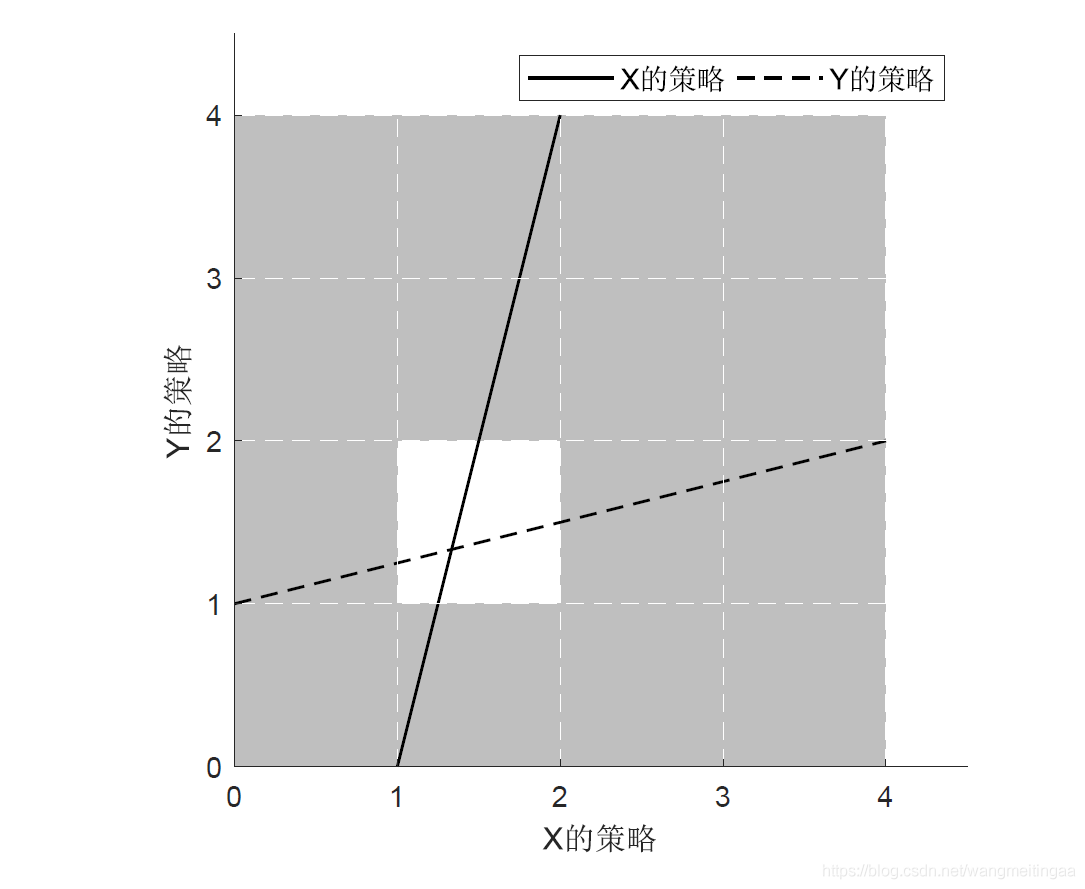
patch('Faces',f1,'Vertices',v1,...
'EdgeColor',[0.75 0.75 0.75],'FaceColor',[0.75 0.75 0.75]);
g=gca
g.XTick=[0:4]
g.YTick=[0:4]
g.XLim=[0 4.5]
g.YLim=[0 4.5]
grid on
g.Layer = 'top';
g.GridColor=[1 1 1]
g.GridLineStyle='--'
g.GridAlpha = 1
axis square
%挖洞
v2 = [1 1;2 1;2 2;1 2];
f2 = [1 2 3 4];
patch('Faces',f2,'Vertices',v2,...
'EdgeColor',[0.75 0.75 0.75],'FaceColor',[1 1 1]);
%畫函數圖
hold on
f1=@(t) 4*t-4
f2=@(t) 0.25*t+1
f1p=fplot(f1,[1 2],'k','LineWidth',1,'DisplayName','X的策略')
f2p=fplot(f2,[0 4],'--k','LineWidth',1,'DisplayName','Y的策略')
xlabel('X的策略')
ylabel('Y的策略')
legend([f1p f2p],{},'NumColumns',2,'FontSize',10)
%導出為PDF
% saveas(gcf,'qiyan.pdf')
print('qiyan','-dpdf')